FLYR Hospitality Insights + Amadeus Demand360®
Ashley Dehertogh
Senior Product Manager

Revenue managers already know this feeling. Pickup is trending in the right direction, rate shopping data looks healthy, and historical benchmarks confirm where you've been. Then: How are we tracking against the comp set?
And just like that, you're in a second platform. Spreadsheet exported, definitions manually reconciled. Two data sets that were never built to sit next to each other.
Hotel business intelligence has a persistent gap. Your own data tells you how your hotel is performing: what's on the books, where pickup is trending, how you're tracking against budget. What it can't tell you is how the market is moving around you. That data has always lived in a separate tool. Revenue managers bridge that gap through daily manual effort, and every manual step loses context.
This spring, that changes. Demand360 data, powered by Amadeus, arrives in FLYR Hospitality Insights, bringing forward-looking market demand into the same product as everything else. What changes is what you can do with it: explore it, compare it against your own numbers, ask questions of it, and share what you find, all within a product purpose-built for hotel revenue teams.
What this makes possible
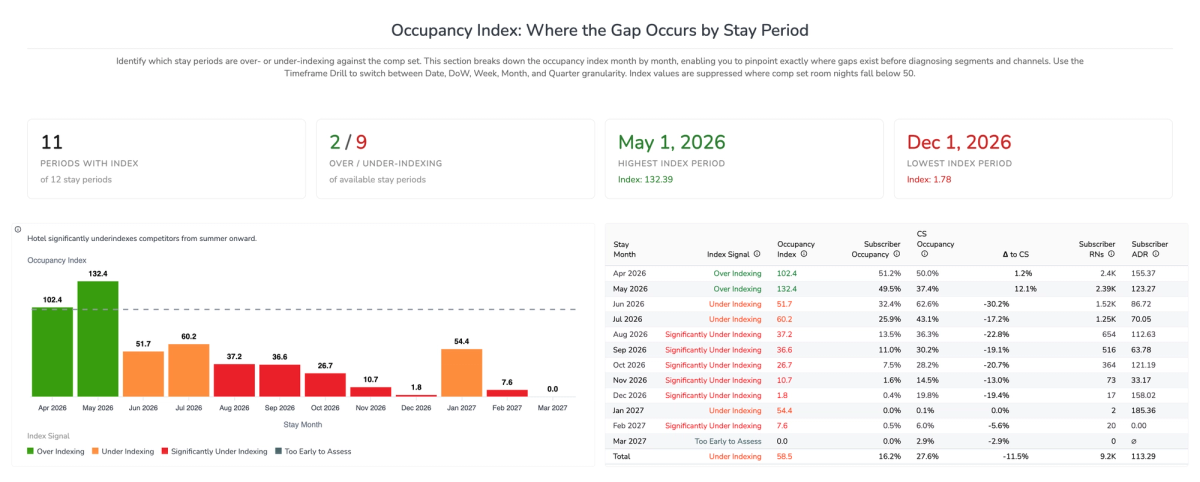
A revenue manager looking at strong OTB numbers has a follow-up question their own data can't answer: is that strength a reflection of the market rising with them, or are they genuinely outpacing their comp set? A pre-built dashboard in Insights is ready to use on day one. It opens with market position: headline occupancy index, subscriber and comp set occupancy, and ADR, then guides a revenue manager through which periods are driving the gap, whether the gap reflects a lead time pattern, and which segments and channels are contributing.
That curated view is the starting point, not the limit. From within the analysis, ask a follow-up question in plain language: which segment is driving that gap, how does it compare to last year? Get an answer immediately, without leaving what you're looking at. Or take it further: with all the data organized and ready, revenue managers can explore freely, taking D360 as the focus or as context alongside their own booking and performance data, following the question wherever it goes.
And once the analysis is there, seamlessly sharing it is built into our product. Dashboards and summaries reach GMs, ownership groups, and commercial teams directly, so the market context revenue managers uncover drives decisions across the organization, not just within one person's workflow.
What's in the benchmarking data
Everything a hotel revenue team needs is pre-configured in FLYR Hospitality Insights from day one: on-the-books reservations, pickup trends, and budget and forecast tracking, all ready to use, no setup required. The benchmarking data joins that foundation alongside existing third-party connections like rate shopping, with no separate login, no exports, and no reconciling definitions that were never meant to align.
It covers:
- Occupancy, ADR, and RevPAR vs. your comp set and market, forward-looking
- Demand indices: Occupancy Index, ADR Index, and RevPAR Index
- Group dynamics: on-the-books group demand, wash trends, and unsold block risk
- Lead time and length-of-stay distribution, by segment and channel
- Same time last year (STLY) comparisons across key metrics
That's the complete picture: historical context, forward-looking demand, down to the segment and channel level.
Demand360 data in Insights is available now for customers with an Amadeus Demand360 agreement.
See FLYR Hospitality in action
Book a demo to see how FLYR Hospitality can drive measurable results for your properties.
Book a demo